Wish you had this feature?
Are you checking this feature out but don’t have it yet in your system?
Contact our sales team today to discuss your needs and our solutions.


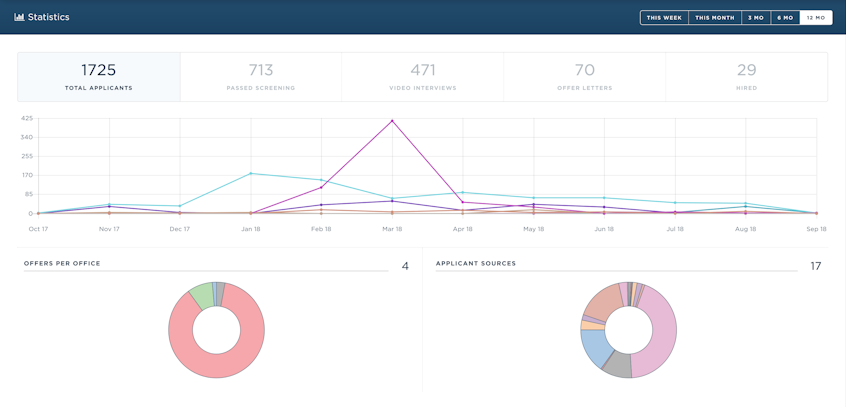
In this view, you will see the performance of each individual company. Each graph is broken down to offices instead of job postings so you can quickly see how each office is performing separate from others. Make sure you’ve switched into your headquarter office’s system to see this dashboard.
The applicant metrics available are the same ones (Total Applicants, Passed Screening, Video Interviews, Offer Letters and Hired), but instead of individual job postings, the numbers will represent each office.
This graph shows you the amount of offers sent out in each of your offices.
This graph shows you the different applicant sources for incoming applicants.